| Valgrind User Manual |
|---|
| Valgrind User Manual |
|---|
Table of Contents
To use this tool, you must specify
--tool=dhat on the Valgrind command line.
DHAT is a tool for examining how programs use their heap allocations.
It tracks the allocated blocks, and inspects every memory access to find which block, if any, it is to. It presents, on an allocation point basis, information about these blocks such as sizes, lifetimes, numbers of reads and writes, and read and write patterns.
Using this information it is possible to identify allocation points with the following characteristics:
potential process-lifetime leaks: blocks allocated by the point just accumulate, and are freed only at the end of the run.
excessive turnover: points which chew through a lot of heap, even if it is not held onto for very long
excessively transient: points which allocate very short lived blocks
useless or underused allocations: blocks which are allocated but not completely filled in, or are filled in but not subsequently read.
blocks with inefficient layout -- areas never accessed, or with hot fields scattered throughout the block.
As with the Massif heap profiler, DHAT measures program progress by counting instructions, and so presents all age/time related figures as instruction counts. This sounds a little odd at first, but it makes runs repeatable in a way which is not possible if CPU time is used.
First off, as for normal Valgrind use, you probably want to compile with
debugging info (the -g option). But by contrast with normal
Valgrind use, you probably do want to turn optimisation on, since you should
profile your program as it will be normally run.
Second, you need to run your program under DHAT to gather the profiling
information. You might need to reduce the --num-callers value
to get reasonably-sized output files, especially if you are profiling a large
program; some trial and error might be needed to find a good value.
Finally, you need to use DHAT's viewer (in a web browser) to get a detailed presentation of that information.
To run DHAT on a program prog, run:
valgrind --tool=dhat prog
The program will execute (slowly). Upon completion, summary statistics that look like this will be printed:
==11514== Total:     823,849,731 bytes in 3,929,133 blocks
==11514== At t-gmax: 133,485,082 bytes in 436,521 blocks
==11514== At t-end:  258,002 bytes in 2,129 blocks
==11514== Reads:     2,807,182,810 bytes
==11514== Writes:    1,149,617,086 bytes
The first line shows how many heap blocks and bytes were allocated over the entire execution.
The second line shows how many heap blocks and bytes were alive at
t-gmax, i.e. the time when the heap size
reached its global maximum (as measured in bytes).
The third line shows how many heap blocks and bytes were alive at
t-end, i.e. the end of execution. In other
words, how many blocks and bytes were not explicitly freed.
The fourth and fifth lines show how many bytes within heap blocks were read and written during the entire execution.
These lines are moderately interesting at best. More useful information can be seen with DHAT's viewer.
As well as printing summary information, DHAT also writes more detailed
profiling information to a file. By default this file is named
dhat.out.<pid> (where
<pid> is the program's process ID), but its name can
be changed with the --dhat-out-file option. This file is JSON,
and intended to be viewed by DHAT's viewer, which is described in the next
section.
The default .<pid> suffix on the
output file name serves two purposes. Firstly, it means you don't have to
rename old log files that you don't want to overwrite. Secondly, and more
importantly, it allows correct profiling with the
--trace-children=yes option of programs that spawn child
processes.
The output file can be big, many megabytes for large applications built with full debugging information.
DHAT's viewer can be run in a web browser by loading the file
dh_view.html. Use the "Load" button to choose
a DHAT output file to view.
If loading takes a long time, it might be worth re-running DHAT with a
smaller --num-callers value to reduce the stack depths,
because this can significantly reduce the size of DHAT's output files.
The first part of the output shows the program command and process ID. For example:
Invocation {
  Command: /home/njn/moz/rust0/build/x86_64-unknown-linux-gnu/stage2/bin/rustc --crate-name tuple_stress src/main.rs
  PID:     18816
}
The second part of the output shows the
t-gmax and
t-end values again. For example:
Times {
  t-gmax: 8,138,210,673 instrs (86.92% of program duration)
  t-end:  9,362,544,994 instrs
}
The third part of the output is the largest and most interesting part, showing the allocation point (AP) tree.
Like any tree, it has a root node, leaf nodes, and non-leaf nodes. The structure of the tree is shown by the lines connecting nodes. Child nodes are beneath their parent and indented one level.
The sub-trees beneath a non-leaf node can be collapsed or expanded by clicking on the node. It is useful to collapse sub-trees that you aren't interested in.
Colours are meaningful, and are intended to ease tree navigation, but the information they represent is also present within the text. (This means that colour-blind users are not denied any information.)
Each leaf node is coloured green. Each non-leaf node is coloured blue
and has a down arrow (▼) next to it when
its sub-tree is expanded. Each non-leaf node is coloured yellow and has a
left arrow (▶) next to it when its sub-tree
is collapsed.
The shade of green, blue or yellow used for a node indicate its significance. Darker shades represent greater significance (in terms of bytes or blocks).
Note that the entire output is text, even the arrows and lines connecting nodes. This means you can copy and paste any part of the output easily into an email, bug report, etc.
The root node looks like this:
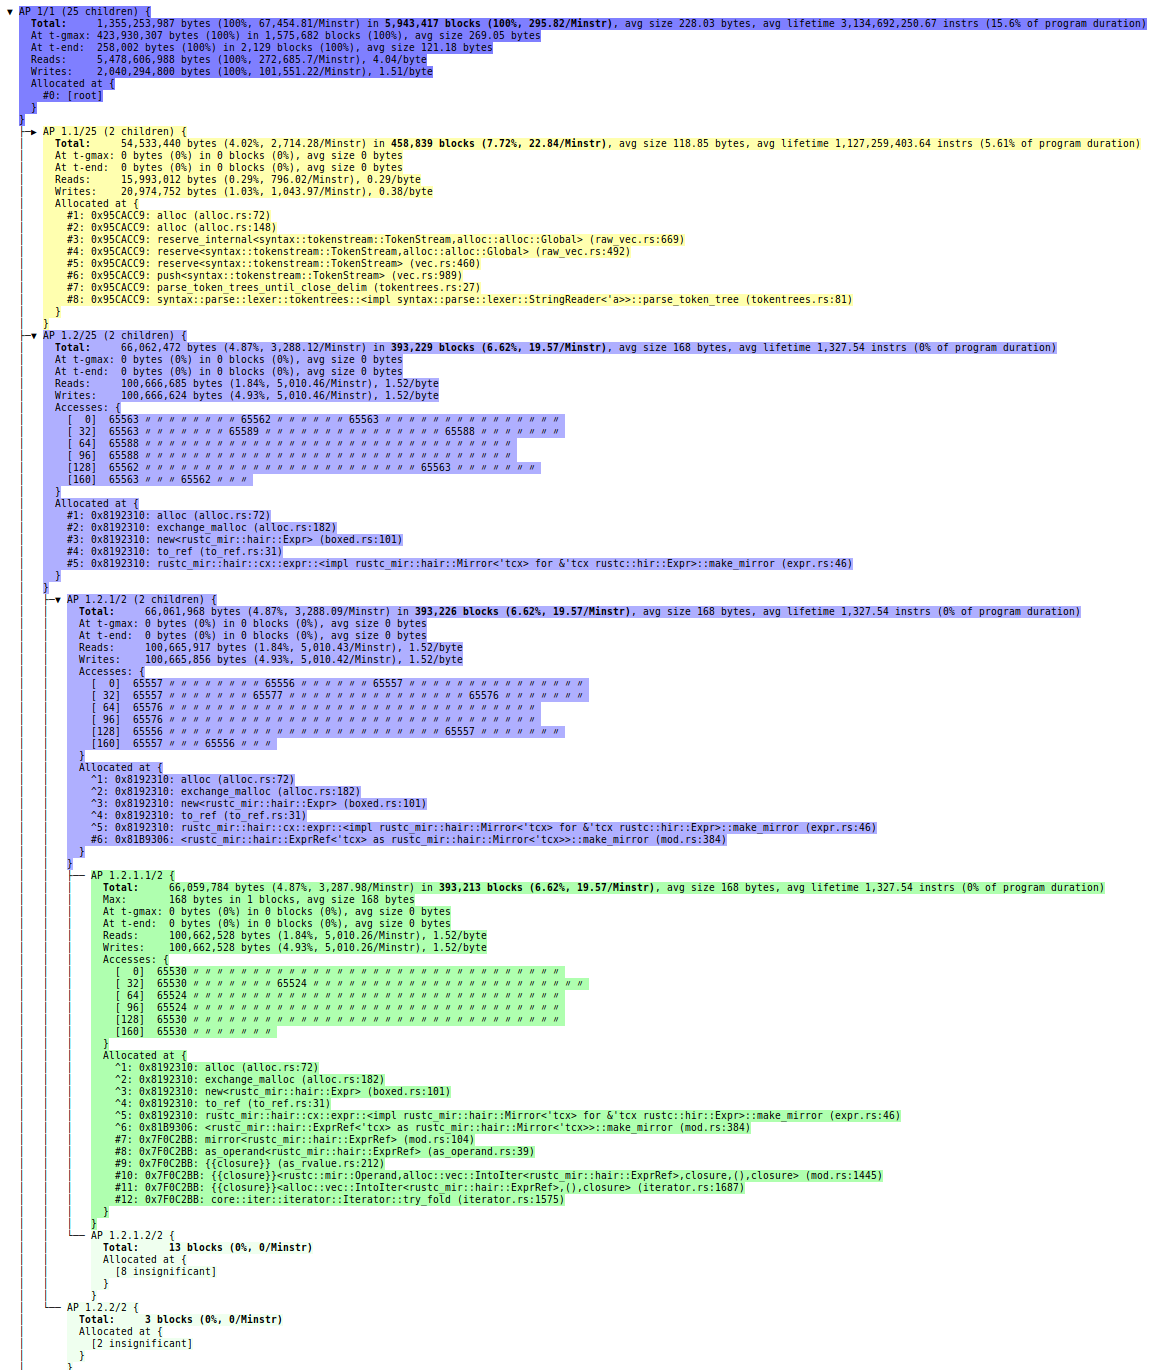
AP 1/1 (25 children) {
  Total:     1,355,253,987 bytes (100%, 67,454.81/Minstr) in 5,943,417 blocks (100%, 295.82/Minstr), avg size 228.03 bytes, avg lifetime 3,134,692,250.67 instrs (15.6% of program duration)
  At t-gmax: 423,930,307 bytes (100%) in 1,575,682 blocks (100%), avg size 269.05 bytes
  At t-end:  258,002 bytes (100%) in 2,129 blocks (100%), avg size 121.18 bytes
  Reads:     5,478,606,988 bytes (100%, 272,685.7/Minstr), 4.04/byte
  Writes:    2,040,294,800 bytes (100%, 101,551.22/Minstr), 1.51/byte
  Allocated at {
    #0: [root]
  }
}
The root node covers the entire execution. The information is a superset of the information shown when DHAT ran, adding details such as allocation rates, average block sizes, block lifetimes, and read and write ratios. The next example will explain these in more detail.
AP nodes further down the tree show information about a subset of allocations. For example:
AP 1.1/25 (2 children) {
  Total:     54,533,440 bytes (4.02%, 2,714.28/Minstr) in 458,839 blocks (7.72%, 22.84/Minstr), avg size 118.85 bytes, avg lifetime 1,127,259,403.64 instrs (5.61% of program duration)
  At t-gmax: 0 bytes (0%) in 0 blocks (0%), avg size 0 bytes
  At t-end:  0 bytes (0%) in 0 blocks (0%), avg size 0 bytes
  Reads:     15,993,012 bytes (0.29%, 796.02/Minstr), 0.29/byte
  Writes:    20,974,752 bytes (1.03%, 1,043.97/Minstr), 0.38/byte
  Allocated at {
    #1: 0x95CACC9: alloc (alloc.rs:72)
    #2: 0x95CACC9: alloc (alloc.rs:148)
    #3: 0x95CACC9: reserve_internal<syntax::tokenstream::TokenStream,alloc::alloc::Global> (raw_vec.rs:669)
    #4: 0x95CACC9: reserve<syntax::tokenstream::TokenStream,alloc::alloc::Global> (raw_vec.rs:492)
    #5: 0x95CACC9: reserve<syntax::tokenstream::TokenStream> (vec.rs:460)
    #6: 0x95CACC9: push<syntax::tokenstream::TokenStream> (vec.rs:989)
    #7: 0x95CACC9: parse_token_trees_until_close_delim (tokentrees.rs:27)
    #8: 0x95CACC9: syntax::parse::lexer::tokentrees::<impl syntax::parse::lexer::StringReader<'a>>::parse_token_tree (tokentrees.rs:81)
  }
}
The first line indicates the node's position in the tree. The
1.1 is a unique identifier for the node and
also says that it is the first child node 1
(which is the root). The /25 says that it is
one of 25 children, i.e. it has 24 siblings. The (2
children) says that this node node has two children of its
own.
Allocations are aggregated by their allocation stack trace. The
Allocated at section shows the allocation
stack trace that is shared by all the blocks covered by this node.
The Total line shows that this node
accounts for 4.02% of all bytes allocated during execution, and 7.72% of all
blocks. These percentages are useful for comparing the significance of
different nodes within a single profile; an AP that accounts for 10% of bytes
allocated is likely to be more interesting than one that accounts for
2%.
The Total line also shows allocation
rates, measured in bytes and blocks per million instructions. These rates are
useful for comparing the significance of nodes across profiles made with
different workloads.
Finally, the Total line shows the
average size and lifetimes of these blocks.
The At t-gmax line says shows that no
blocks from this AP were alive when the global heap peak occurred. In other
words, these blocks do not contribute at all to the global heap peak.
The At t-end line shows that no blocks
were from this AP were alive at shutdown. In other words, all those blocks were
explicitly freed before termination.
The Reads and
Writes lines show how many bytes were read
within this AP's blocks, the fraction this represents of all heap reads, and
the read rate. Finally, it shows the read ratio, which is the number of reads
per byte. In this case the number is 0.29, which is quite low -- if no byte was
read twice, then only 29% of the allocated bytes, which means that at least 71%
of the bytes were never read! This suggests that the blocks are being
underutilized and might be worth optimizing.
The Writes lines is similar to the
Reads line. In this case, at most 38% of the
bytes are ever written, and at least 62% of the bytes were never written.
The Reads and
Writes measurements suggest that the blocks
are being under-utilised and might be worth optimizing. Having said that, this
kind of under-utilisation is common in data structures that grow, such as
vectors and hash tables, and isn't always fixable.
This is a leaf node:
AP 1.1.1.1/2 {
  Total:     31,460,928 bytes (2.32%, 1,565.9/Minstr) in 262,171 blocks (4.41%, 13.05/Minstr), avg size 120 bytes, avg lifetime 986,406,885.05 instrs (4.91% of program duration)
  Max:       16,779,136 bytes in 65,543 blocks, avg size 256 bytes
  At t-gmax: 0 bytes (0%) in 0 blocks (0%), avg size 0 bytes
  At t-end:  0 bytes (0%) in 0 blocks (0%), avg size 0 bytes
  Reads:     5,964,704 bytes (0.11%, 296.88/Minstr), 0.19/byte
  Writes:    10,487,200 bytes (0.51%, 521.98/Minstr), 0.33/byte
  Allocated at {
    ^1: 0x95CACC9: alloc (alloc.rs:72)
    ^2: 0x95CACC9: alloc (alloc.rs:148)
    ^3: 0x95CACC9: reserve_internal<syntax::tokenstream::TokenStream,alloc::alloc::Global> (raw_vec.rs:669)
    ^4: 0x95CACC9: reserve<syntax::tokenstream::TokenStream,alloc::alloc::Global> (raw_vec.rs:492)
    ^5: 0x95CACC9: reserve<syntax::tokenstream::TokenStream> (vec.rs:460)
    ^6: 0x95CACC9: push<syntax::tokenstream::TokenStream> (vec.rs:989)
    ^7: 0x95CACC9: parse_token_trees_until_close_delim (tokentrees.rs:27)
    ^8: 0x95CACC9: syntax::parse::lexer::tokentrees::<impl syntax::parse::lexer::StringReader<'a>>::parse_token_tree (tokentrees.rs:81)
    ^9: 0x95CAC39: parse_token_trees_until_close_delim (tokentrees.rs:26)
    ^10: 0x95CAC39: syntax::parse::lexer::tokentrees::<impl syntax::parse::lexer::StringReader<'a>>::parse_token_tree (tokentrees.rs:81)
    #11: 0x95CAC39: parse_token_trees_until_close_delim (tokentrees.rs:26)
    #12: 0x95CAC39: syntax::parse::lexer::tokentrees::<impl syntax::parse::lexer::StringReader<'a>>::parse_token_tree (tokentrees.rs:81)
  }
}
The 1.1.1.1/2 indicates that this node
is a great-grandchild of the root; is the first grandchild of the node in the
previous example; and has no children.
Leaf nodes contain an additional Max
line, indicating the peak memory use for the blocks covered by this AP. (This
peak may have occurred at a time other than
t-gmax.) In this case, 31,460,298 bytes were
allocated from this AP, but the maximum size alive at once was 16,779,136
bytes.
Stack frames that begin with a ^ rather
than a # are copied from ancestor nodes.
(In this example, the first 8 frames are identical to those from the node in
the previous example.) These frames could be found by tracing back through
ancestor nodes, but that can be annoying, which is why they are duplicated.
This also means that each node makes complete sense on its own.
If all blocks covered by an AP node have the same size, an additional
Accesses field will be present. It indicates
how the reads and writes within these blocks were distributed. For
example:
Total:     8,388,672 bytes (0.62%, 417.53/Minstr) in 262,146 blocks (4.41%, 13.05/Minstr), avg size 32 bytes, avg lifetime 16,726,078,401.51 instrs (83.25% of program duration)
At t-gmax: 8,388,672 bytes (1.98%) in 262,146 blocks (16.64%), avg size 32 bytes
At t-end:  0 bytes (0%) in 0 blocks (0%), avg size 0 bytes
Reads:     9,109,682 bytes (0.17%, 453.41/Minstr), 1.09/byte
Writes:    7,340,088 bytes (0.36%, 365.34/Minstr), 0.88/byte
Accesses: {
  [  0]  65547 7 8 4 65529 〃 〃 〃 16 〃 〃 〃 12 〃 〃 〃 〃 〃 〃 〃 〃 〃 〃 〃 65542 〃 〃 〃 - - - -
}
Every block covered by this AP was 32 bytes. Within all of those blocks, byte 0 was accessed (read or written) 65,547 times, byte 1 was accessed 7 times, byte 2 was accessed 8 times, and so on.
The ditto symbol (〃) means "same access
count as the previous byte".
A dash (-) means "zero". (It is used
instead of 0 because it makes unaccessed
regions more easily identifiable.)
The infinity symbol (∞, not present in
this example) means "exceeded the maximum tracked count".
Block layout can often be inferred from counts. For example, these blocks probably have four separate byte-sized fields, followed by a four-byte field, and so on.
Access counts can be useful for identifying data alignment holes or other layout inefficiencies.
The AP tree is very large and many nodes represent tiny numbers of blocks and bytes. Therefore, DHAT's viewer aggregates insignificant nodes like this:
AP 1.14.2/2 {
  Total:     5,175 blocks (0.09%, 0.26/Minstr)
  Allocated at {
    [5 insignificant]
  }
}
Much of the detail is stripped away, leaving only basic measurements, along with an indication of how many nodes were aggregated together (5 in this case).
Below the AP tree is a line like this:
AP significance threshold: total >= 59,434.17 blocks (1%)
It shows the function used to determine if an AP node is significant. All nodes that don't satisfy this function are aggregated. It is occasionally useful if you don't understand why an AP node has been aggregated. The exact threshold depends on the sort metric (see below).
Finally, the bottom of the page shows a legend that explains some of the terms, abbreviations and symbols used in the output.
The order in which sub-trees are sorted can be changed via the "Sort metric" drop-down menu at the top of DHAT's viewer. Different sort metrics can be useful for finding different things. Some sort metrics also incorporate some filtering, so that only nodes meeting a particular criteria are shown.
The total number of bytes allocated during the execution. Highly useful for evaluating heap churn, though not quite as useful as "Total (blocks)".
The total number of blocks allocated during the execution. Highly useful for evaluating heap churn; reducing the number of calls to the allocator can significantly speed up a program. This is the default sort metric.
Like "Total (blocks)", but shows only very small blocks. Moderately useful, because such blocks are often easy to avoid allocating.
Like "Total (blocks)", but shows only very short-lived blocks. Moderately useful, because such blocks are often easy to avoid allocating.
Like "Total (bytes)", but shows only blocks that are never read or never written to (or both). Highly useful, because such blocks indicate poor use of memory and are often easy to avoid allocating. For example, sometimes a block is allocated and written to but then only read if a condition C is true; in that case, it may be possible to delay creating the block until condition C is true. Alternatively, sometimes blocks are created and never used; such blocks are trivial to remove.
Like "Total (bytes), zero reads or zero writes" but for blocks. Highly useful.
Like "Total (bytes)", but shows only blocks that have low numbers of reads or low numbers of writes (or both). Moderately useful, because such blocks indicate poor use of memory.
Like "Total (bytes), low-access", but for blocks.
This shows the breakdown of memory at the point of peak heap memory usage. Highly useful for reducing peak memory usage.
This shows the breakdown of memory at program termination. Highly useful for identifying process-lifetime leaks.
The number of bytes read within heap blocks. Occasionally useful.
Like "Reads (bytes)", but only shows blocks with high read ratios. Occasionally useful for identifying hot areas of memory.
Like "Reads (bytes)", but for writes. Occasionally useful.
Like "Reads (bytes), high-access", but for writes. Occasionally useful.
The values within a node that represent the chosen sort metric are shown in bold, so they stand out.
Here is part of an AP node found with "Total (blocks), tiny", showing blocks with an average size of only 8.67 bytes:
Total: 3,407,848 bytes (0.25%, 169.62/Minstr) in 393,214 blocks (6.62%, 19.57/Minstr), avg size 8.67 bytes, avg lifetime 1,167,795,629.1 instrs (5.81% of program duration)
Here is part of an AP node found with "Total (blocks), short-lived", showing blocks with an average lifetime of only 181.75 instructions:
Total: 23,068,584 bytes (1.7%, 1,148.19/Minstr) in 262,143 blocks (4.41%, 13.05/Minstr), avg size 88 bytes, avg lifetime 181.75 instrs (0% of program duration)
Here is an example of an AP identified with "Total (blocks), zero reads or zero writes", showing blocks that are allocated but never touched:
Total:     7,339,920 bytes (0.54%, 365.33/Minstr) in 262,140 blocks (4.41%, 13.05/Minstr), avg size 28 bytes, avg lifetime 1,141,103,997.69 instrs (5.68% of program duration)
Max:       3,669,960 bytes in 131,070 blocks, avg size 28 bytes
At t-gmax: 3,336,400 bytes (0.79%) in 119,157 blocks (7.56%), avg size 28 bytes
At t-end:  0 bytes (0%) in 0 blocks (0%), avg size 0 bytes
Reads:     0 bytes (0%, 0/Minstr), 0/byte
Writes:    0 bytes (0%, 0/Minstr), 0/byte
All the blocks identified by these APs are good candidates for optimization.
DHAT-specific command-line options are:
--dhat-out-file=<file>
Write the profile data to
file rather than to the default
output file,
dhat.out.<pid>. The
%p and %q format specifiers
can be used to embed the process ID and/or the contents of an
environment variable in the name, as is the case for the core
option --log-file.
Note that stacks by default have 12 frames. This may be more than
necessary, in which case the --num-callers flag can be used to
reduce the number, which may make DHAT run slightly faster.